
Company Protection Overview
Overview
Section titled “Overview”The Company Protection overview summarises the risks to your organization's own digital assets. Open it from "Company Protection" > "Overview".
The page covers only your organization. Third parties you monitor are under "Third Party Risk", and their findings are not counted here.
Each module section appears only if your subscription includes that module.
Company details and finding counts
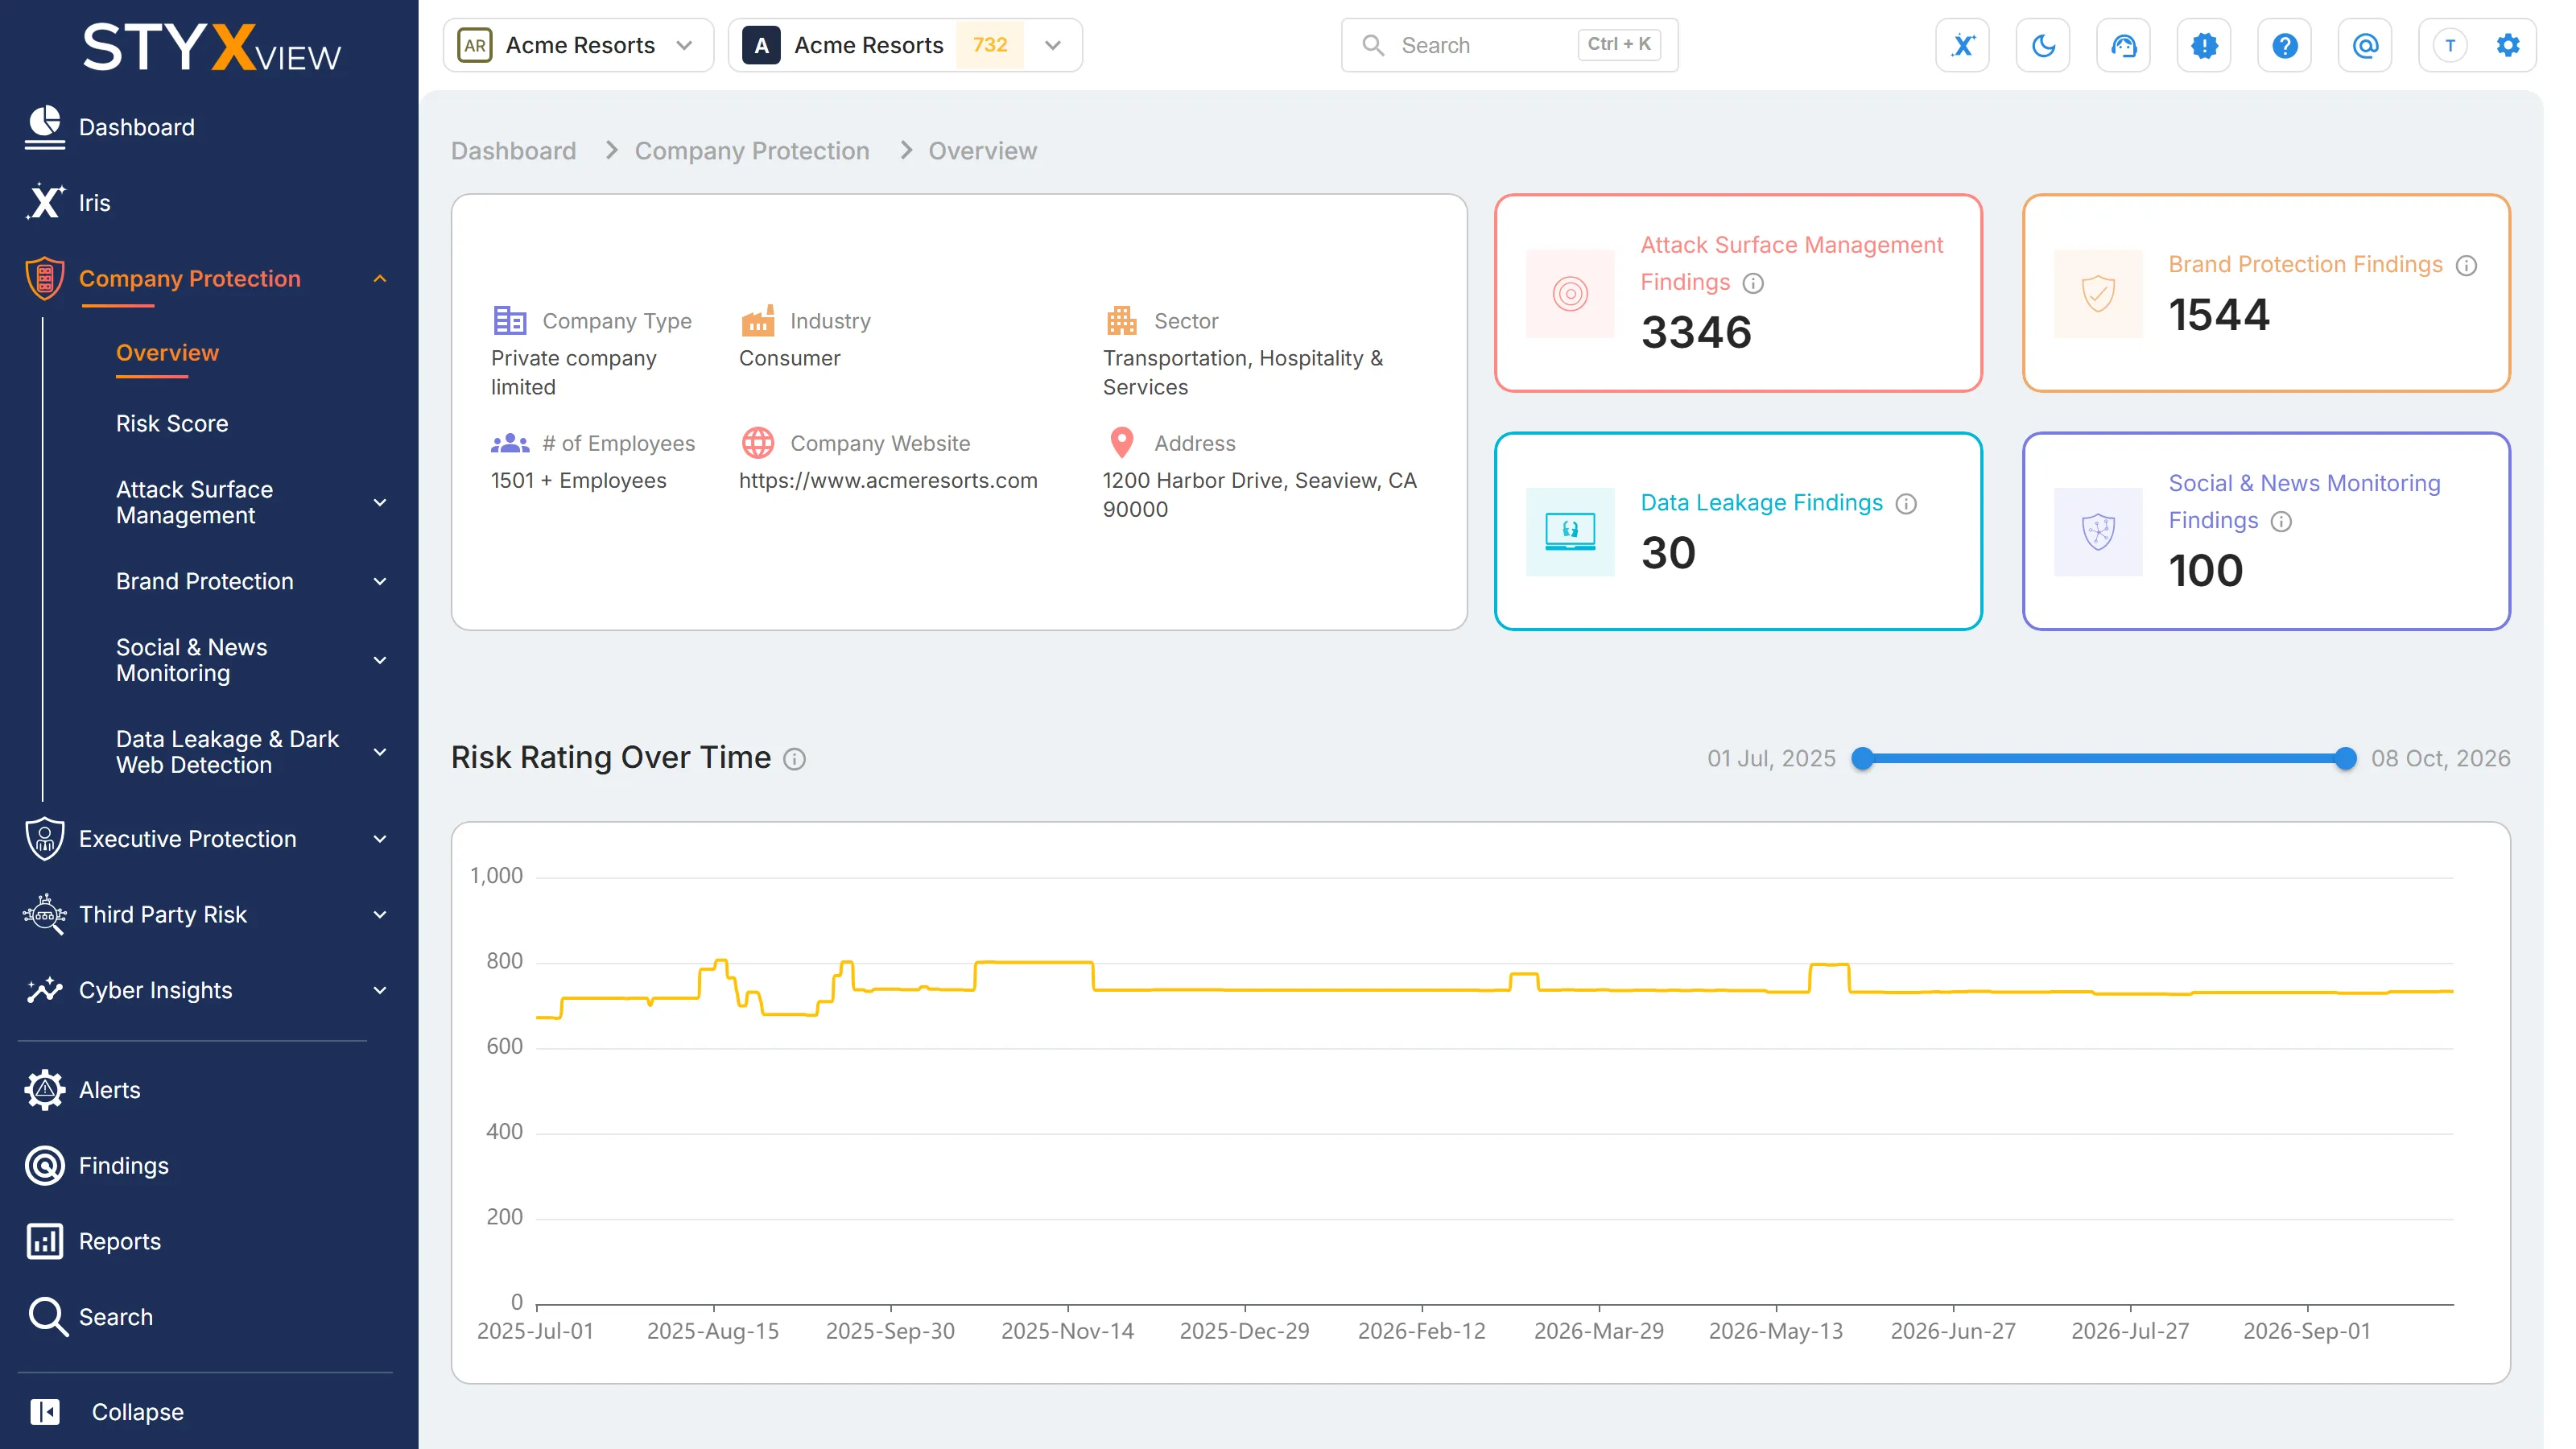
Section titled “Company details and finding counts”The card on the left shows the details recorded for your organization: "Industry", "Sector", "Company Type", "# of Employees", "Company Website", and "Address". A detail that has not been recorded is left out. If none have been recorded, the card reads "No company details available."
The tiles on the right count the open findings in each module: "Attack Surface Management Findings", "Brand Protection Findings", "Data Leakage Findings", and "Social & News Monitoring Findings". Open means any status except "Resolved", "Closed Without Action", and "No Longer Seen". Select a tile to open that module's overview.
Risk Rating Over Time
Section titled “Risk Rating Over Time”A line chart of your organization's risk score over time, shown when your subscription includes Attack Surface Management. Drag the ends of the slider above the chart to narrow the date range. Select a point on the line to open the "Risk Score" page for that date. See Risk Score Overview.
Attack Surface Management
Section titled “Attack Surface Management”- "Assets" counts what Attack Surface Management monitors for you, by category: "DNS", "Domains", "Social Media", "Others", "Mobile Apps", "IP Address Infrastructure", and "Website Infrastructure". Select a category to open its tab under "Monitored Assets", or the ASM Overview where a category has no tab of its own.
- "Findings" is a donut chart of open findings by type: "Blocklisted Assets", "DNS Health Issues", "Potentially Insecure Ports", "Insecure Protocols", "Vulnerabilities", "Website Header Issues", and "TLS/SSL Certificate Issues".
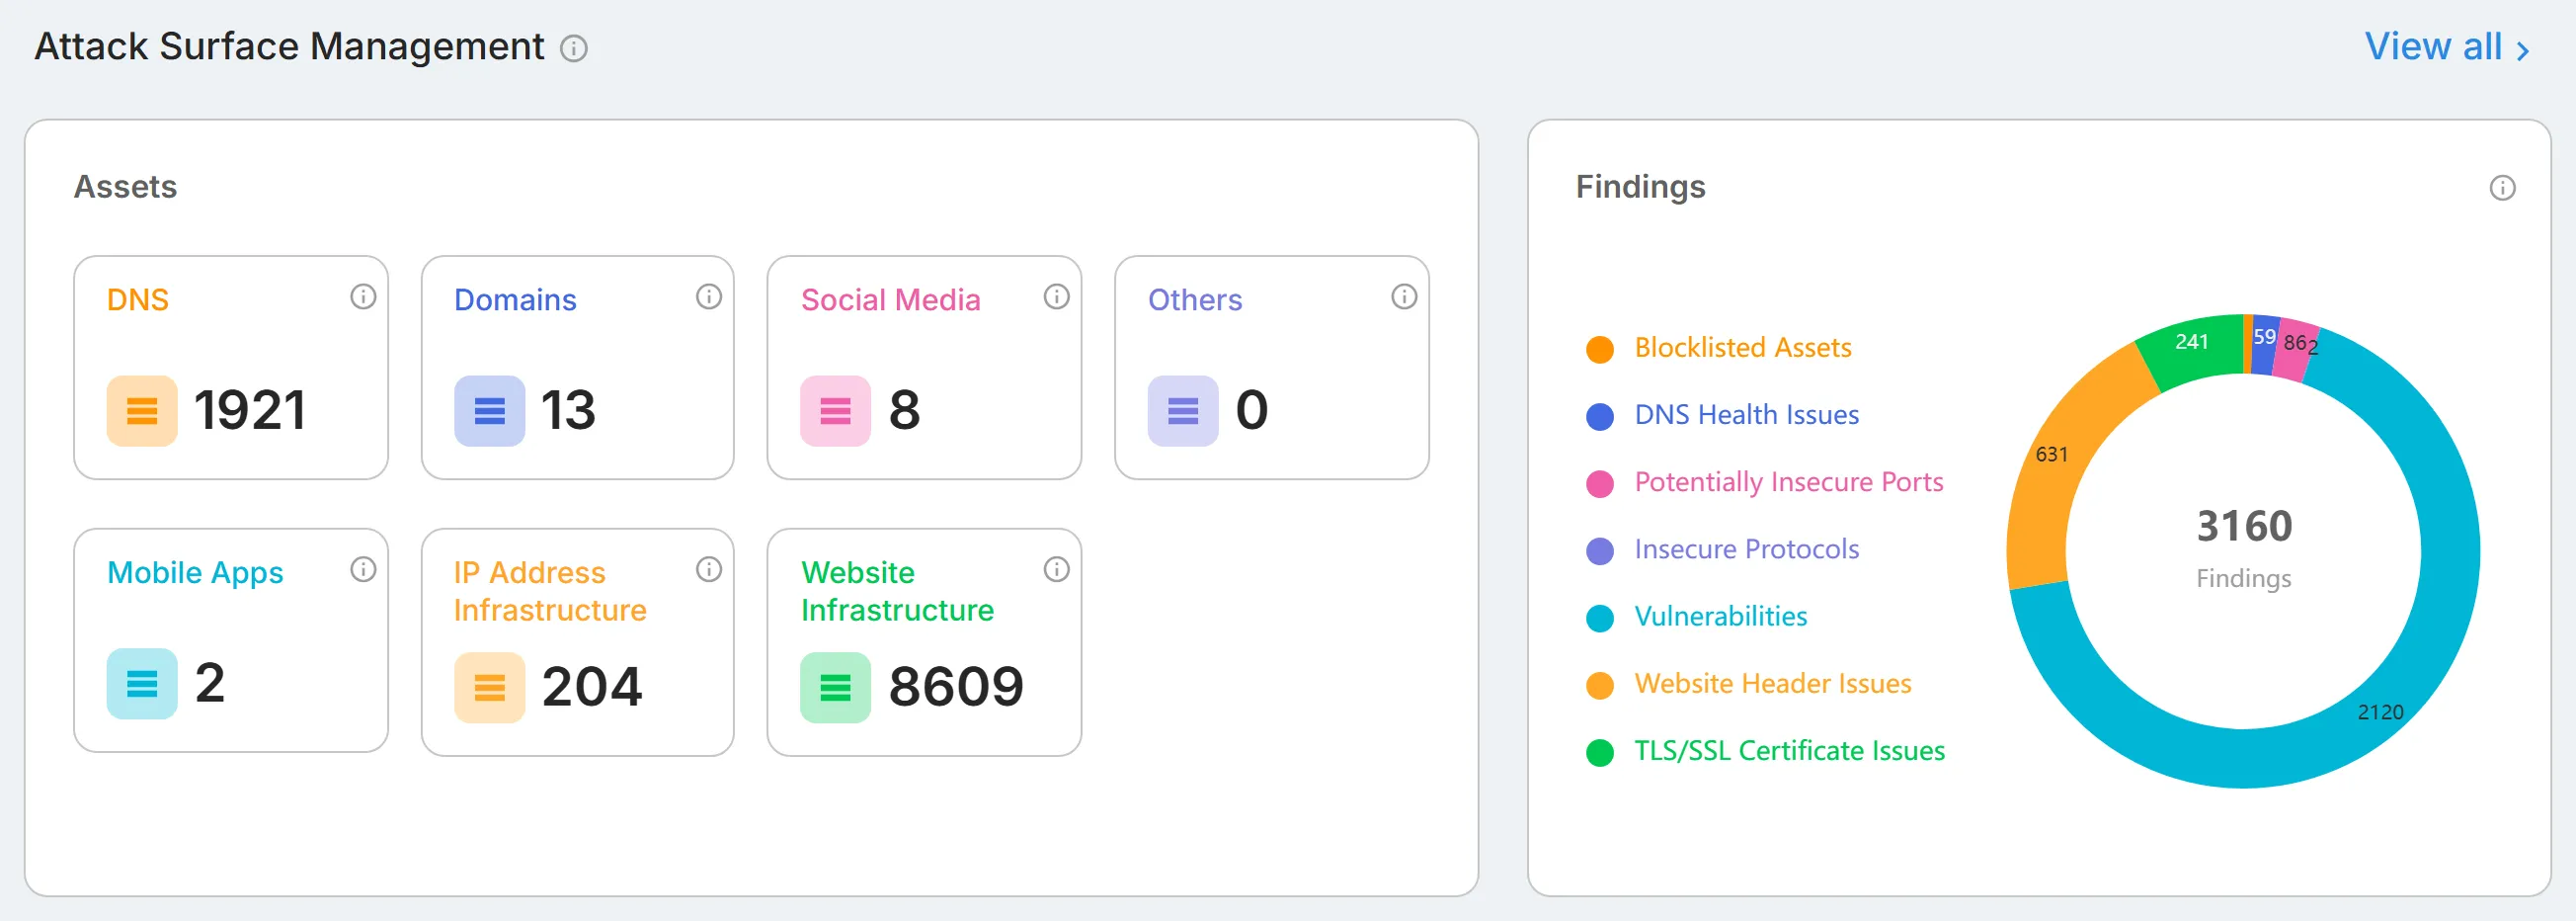
Select "View all" to open the ASM Overview.
Brand Protection
Section titled “Brand Protection”Four counts: "High Severity Findings Requiring Attention", "Overall Findings Requiring Attention", "Suspicious Artifacts On Watchlist", and "Response Actions In Progress/Overall". Below them are three charts: "Brand Protection Findings - Requiring Attention", "Impersonating Social Media Accounts - by Severity", and "Impersonating Social Media Accounts - by Platform".
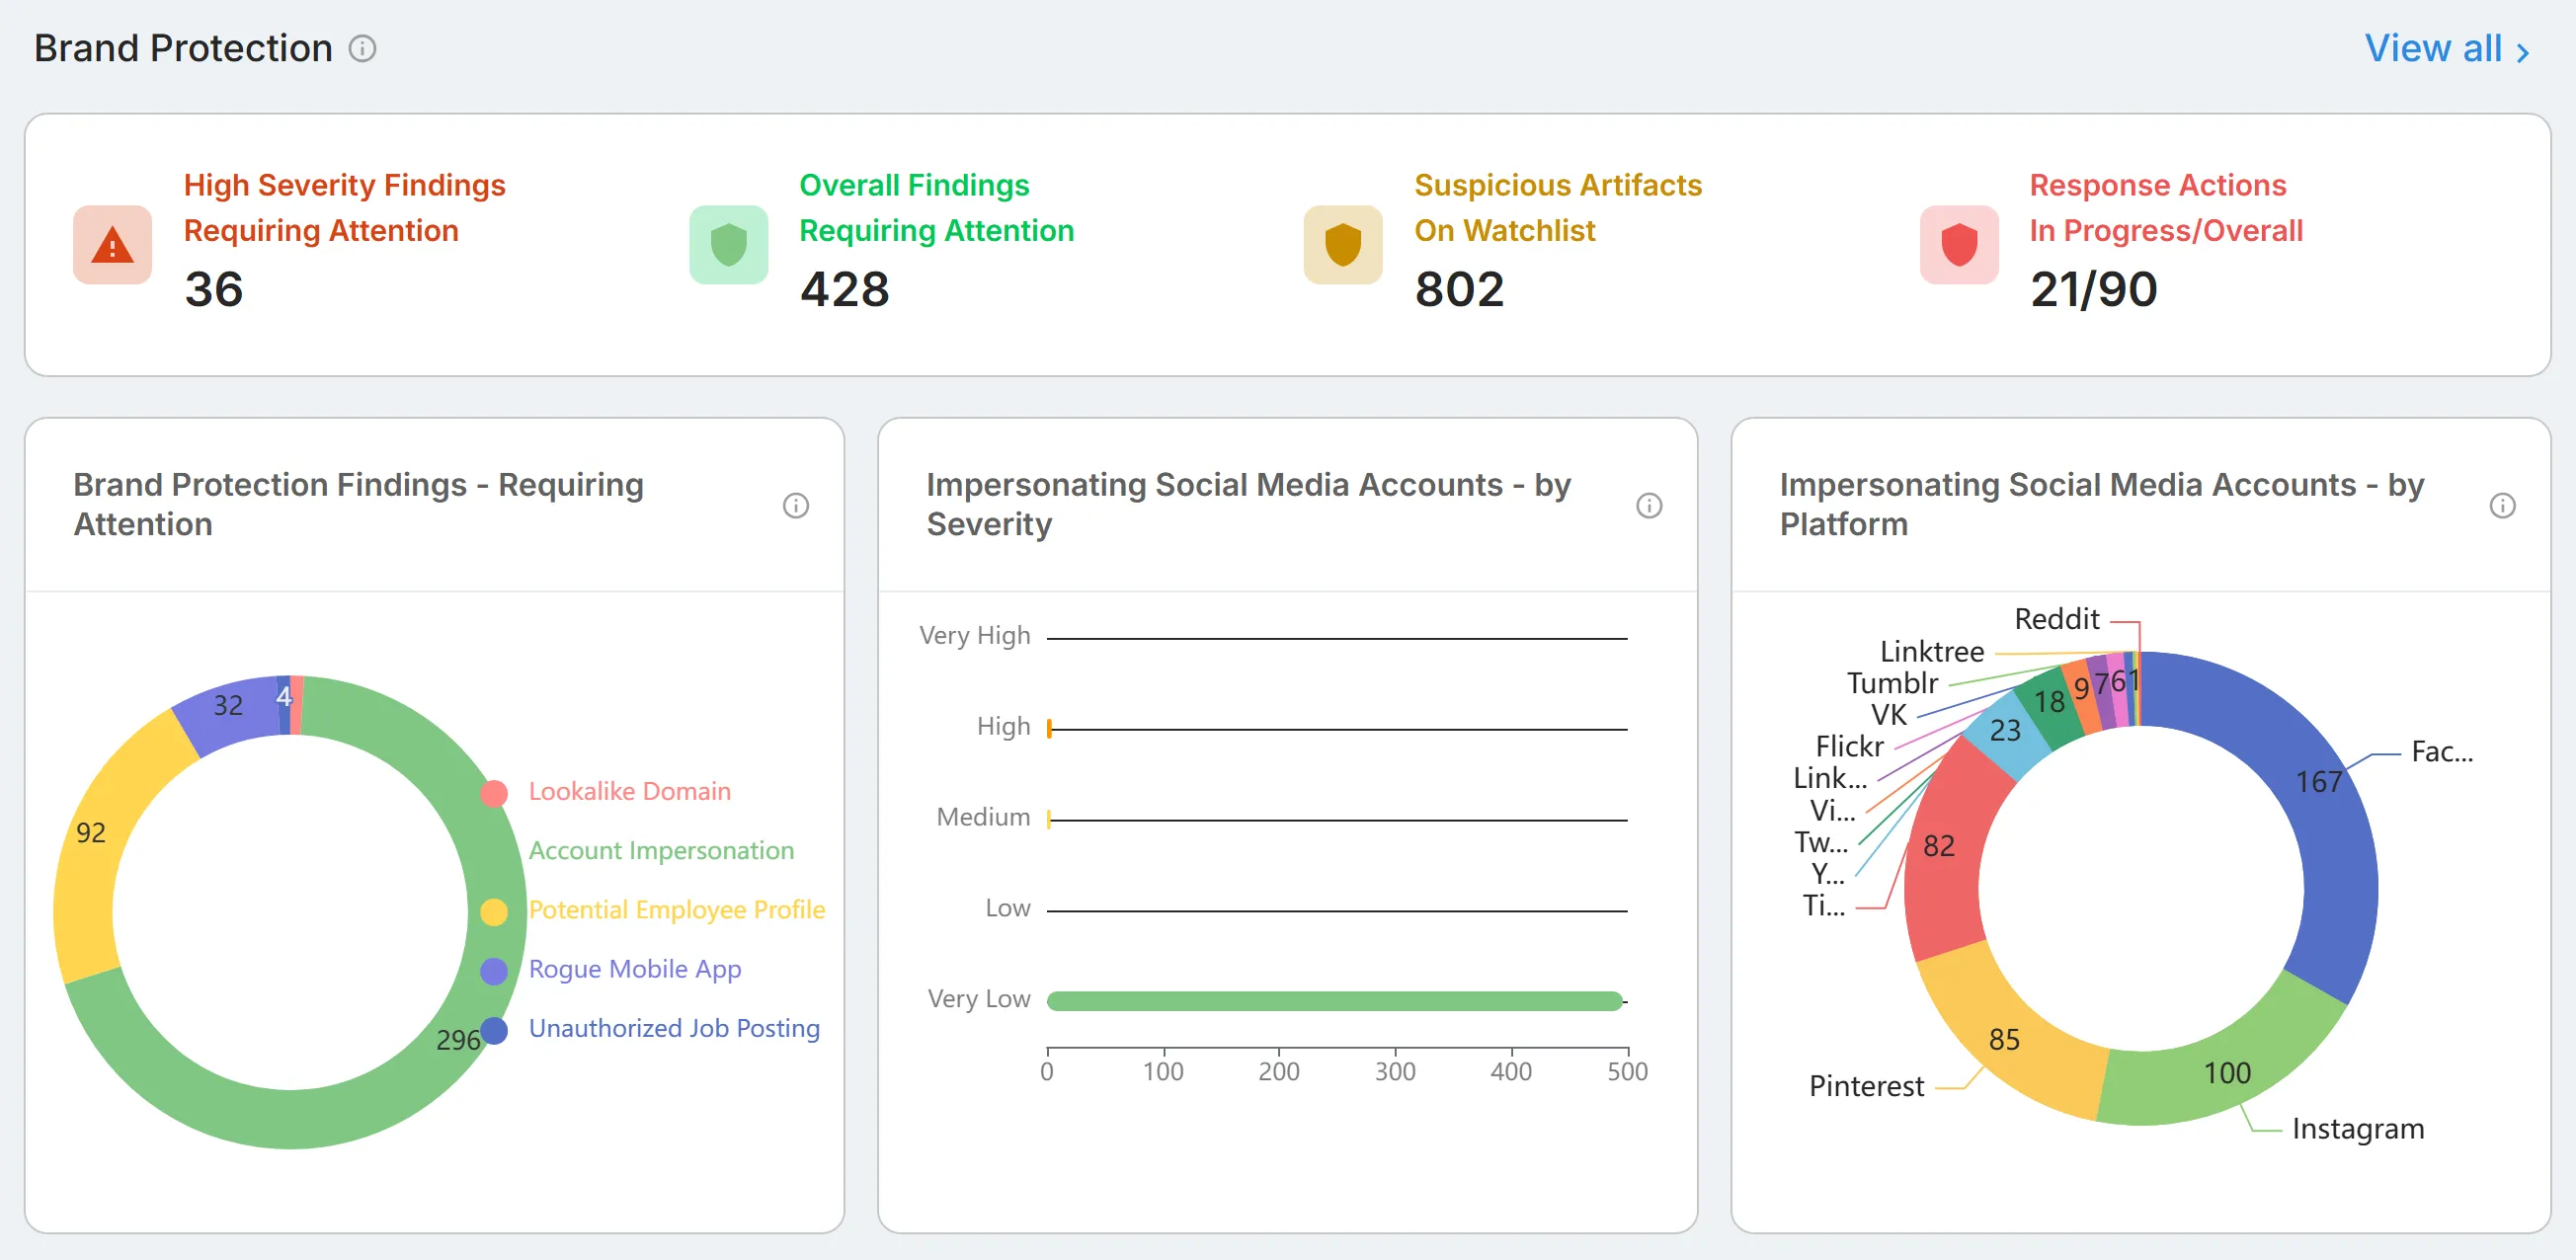
Select "View all" to open the Brand Protection Overview.
Dark Web and Data Leakage
Section titled “Dark Web and Data Leakage”Counts for "User Accounts", "Credential Snippets", "Secret Leaks", and "Exposed Code Repository". Select "View all" to open the Data Leakage & Dark Web Detection overview.

Social & News Monitoring
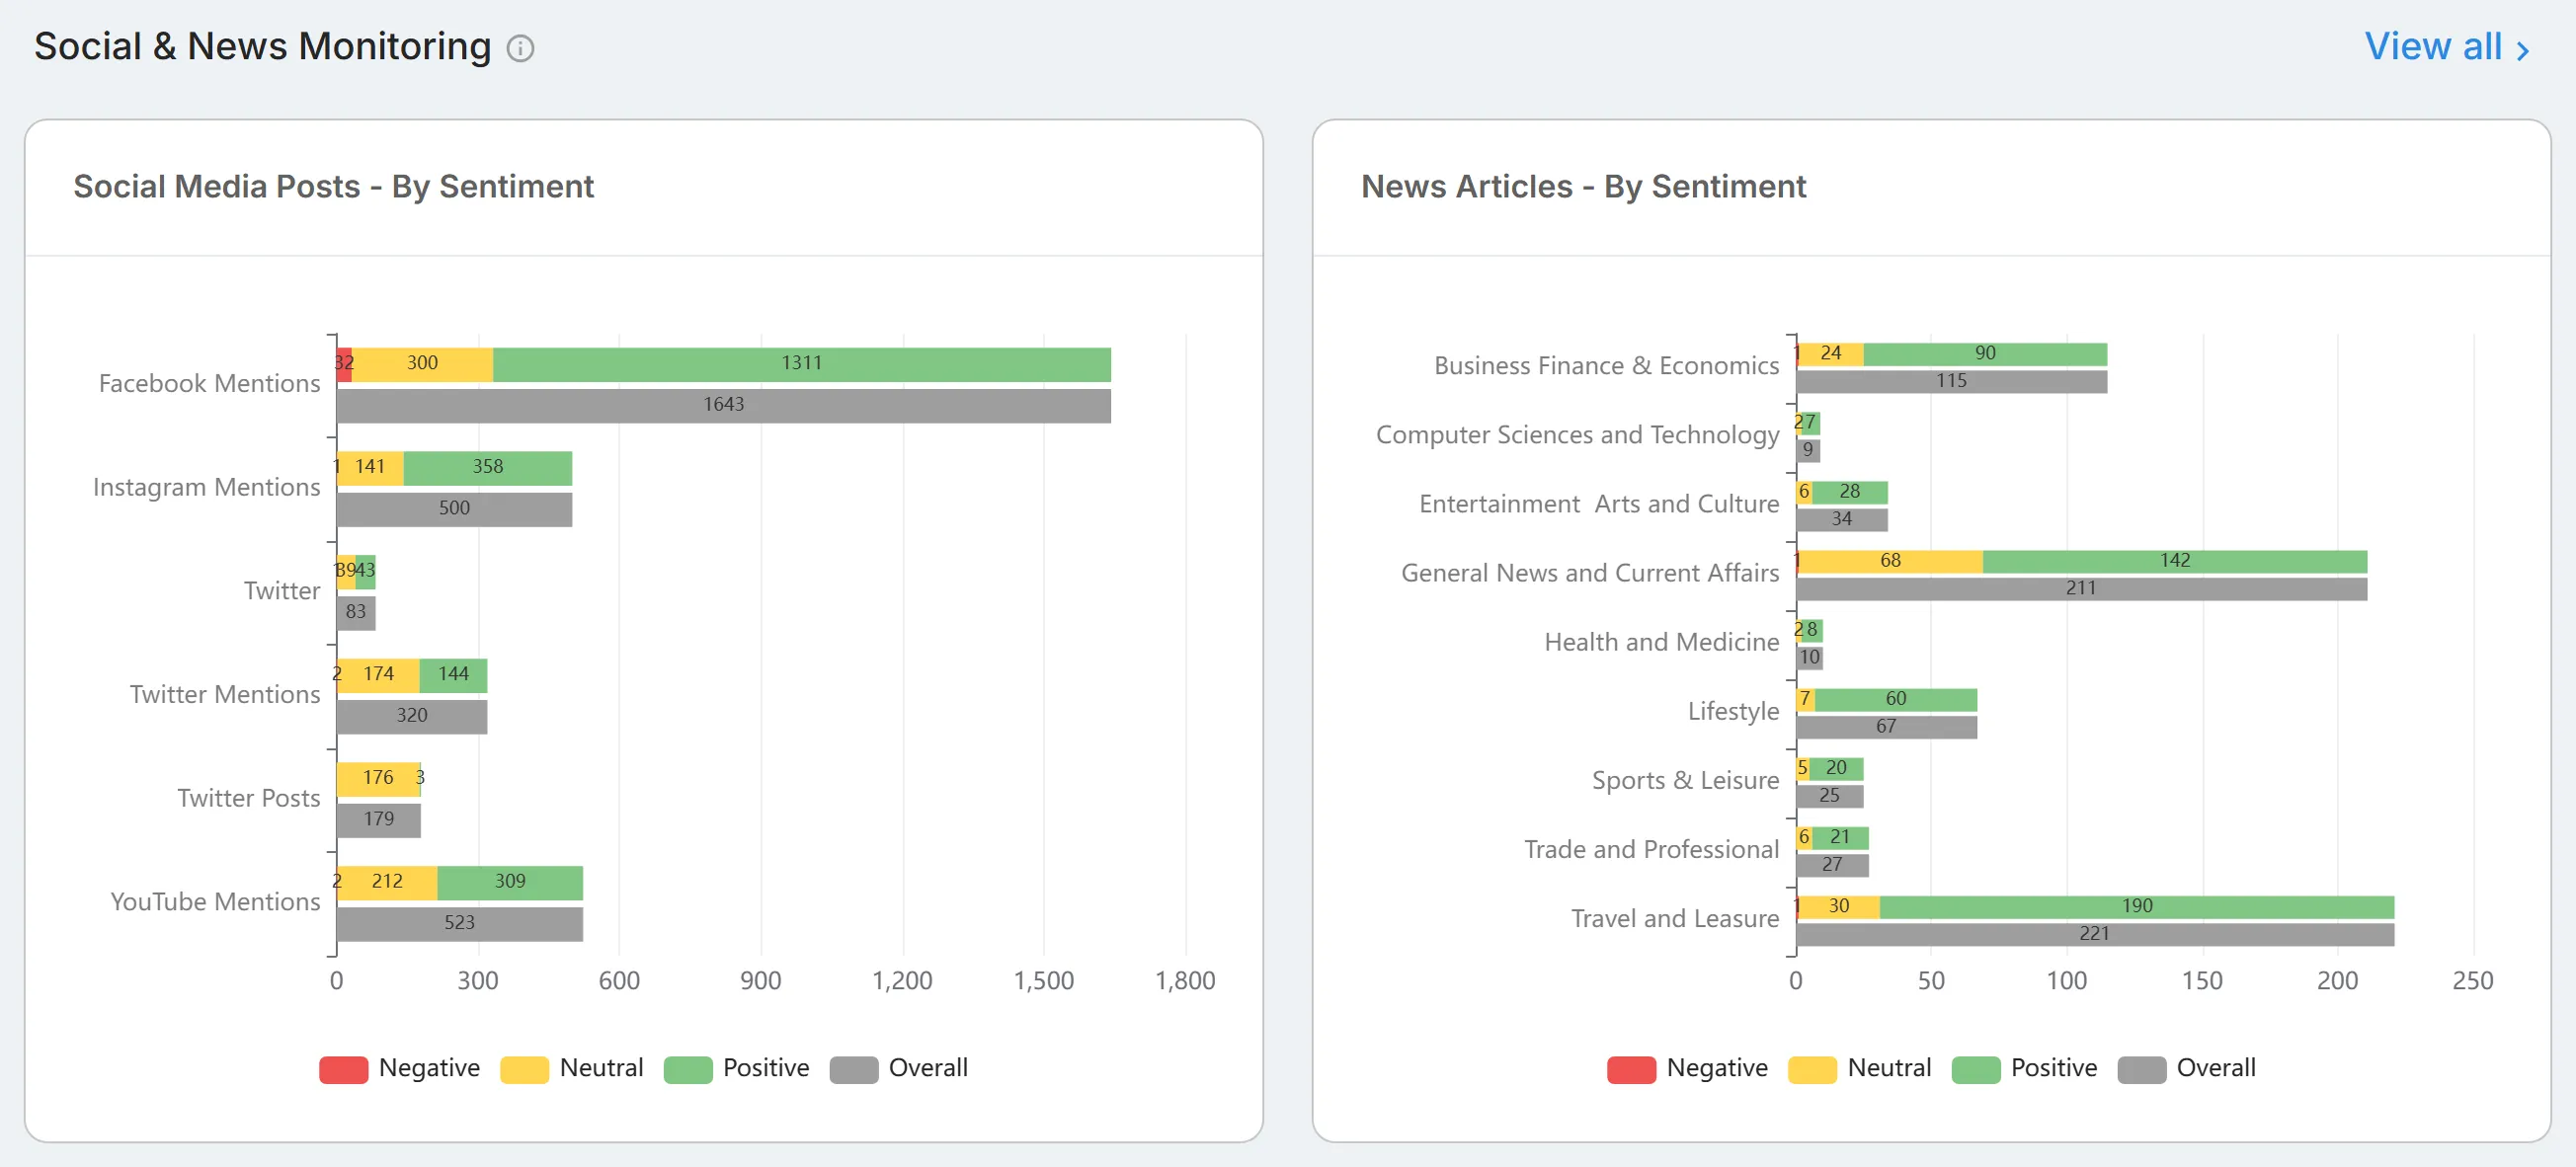
Section titled “Social & News Monitoring”Two charts, "Social Media Posts - By Sentiment" and "News Articles - By Sentiment", followed by "Posts Over Time". Select "View all" to open the Social & News Monitoring overview.