
Attack Surface Management Overview
Overview
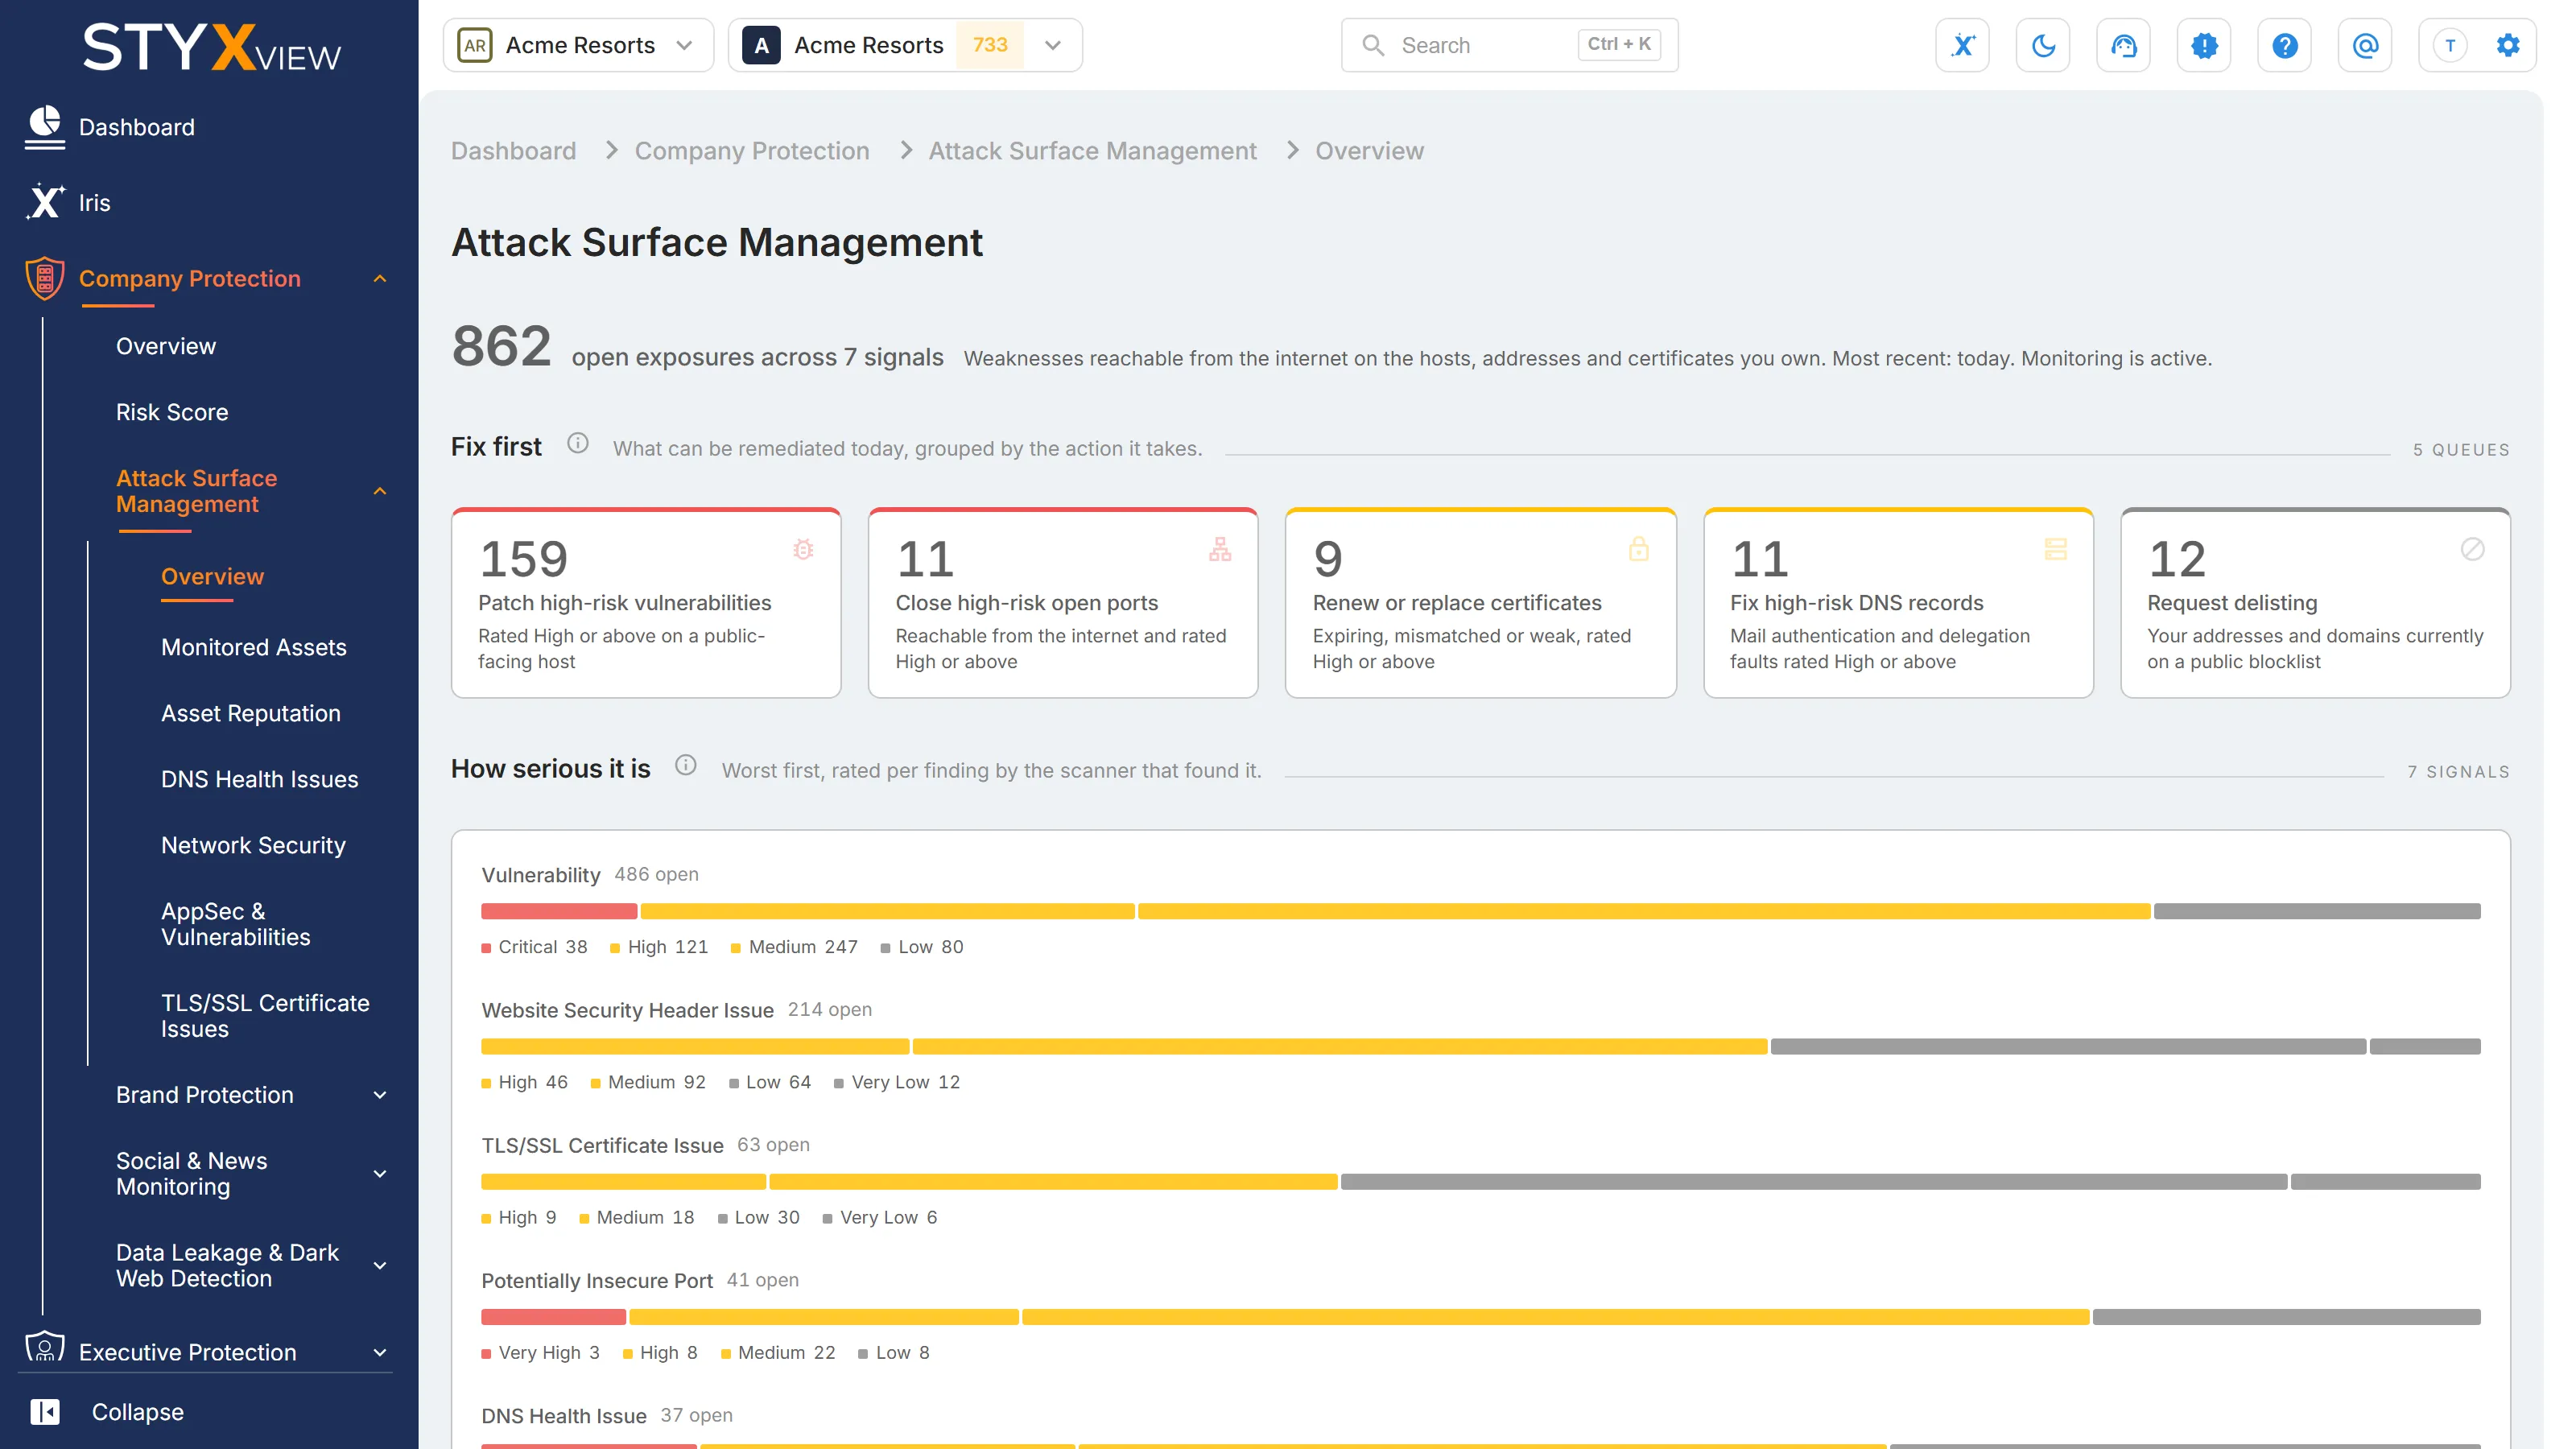
Section titled “Overview”The Attack Surface Management overview shows what needs fixing on the internet-facing side of your organisation, and what StyxView watches to find it. Open it from "Company Protection" > "Attack Surface Management" > "Overview".
The page runs in the order you work: what to fix first, how serious the rest is, what is being watched, where the exposure sits, and every signal behind it. Almost every count opens the list it was counted from.
At the top, a large number counts your open exposures, followed by "open exposures across" and the number of signals that have at least one. A signal is one kind of finding, such as "Vulnerability" or "DNS Health Issue". Open means not marked as a false positive and not "Resolved", "Closed Without Action", or "No Longer Seen". The line beside it says when the most recent exposure was found, and ends with "Monitoring is active." while scanning is switched on for your organisation. The headline does not open a list.
The figures are calculated once a day, so a change you make in a list can take up to a day to show here.
Each section heading has an info icon. Hover over it to see what the section counts and how to read it.
Fix first
Section titled “Fix first”Five queues of work you can do now, each named after the action it takes. They are deliberately not a count of every finding: four of them count only findings rated High or above, so each stays short enough to work through. They are ordered by how directly a fix removes the exposure, so patching comes first and delisting, which depends on someone else acting, comes last. Select a queue to open its list, filtered to what it counted.
| Queue | What it counts | Opens |
|---|---|---|
| "Patch high-risk vulnerabilities" | Open vulnerabilities rated "High" or "Critical". | Vulnerabilities, filtered to those ratings. |
| "Close high-risk open ports" | Open potentially insecure ports rated "High" or "Very High". | Potentially Insecure Ports, filtered to those ratings. |
| "Renew or replace certificates" | Open certificate issues rated "High" or "Very High". | TLS/SSL Certificate Issues, filtered to those ratings. |
| "Fix high-risk DNS records" | Open DNS health issues rated "High" or "Very High". | DNS Health Issues, filtered to those ratings. |
| "Request delisting" | Every open blocklisted asset, whatever its rating. | Blocklisted Assets. |
A queue showing 0 has nothing at that level today. The counts do not go down as you work through a queue until the next daily update.

How serious it is
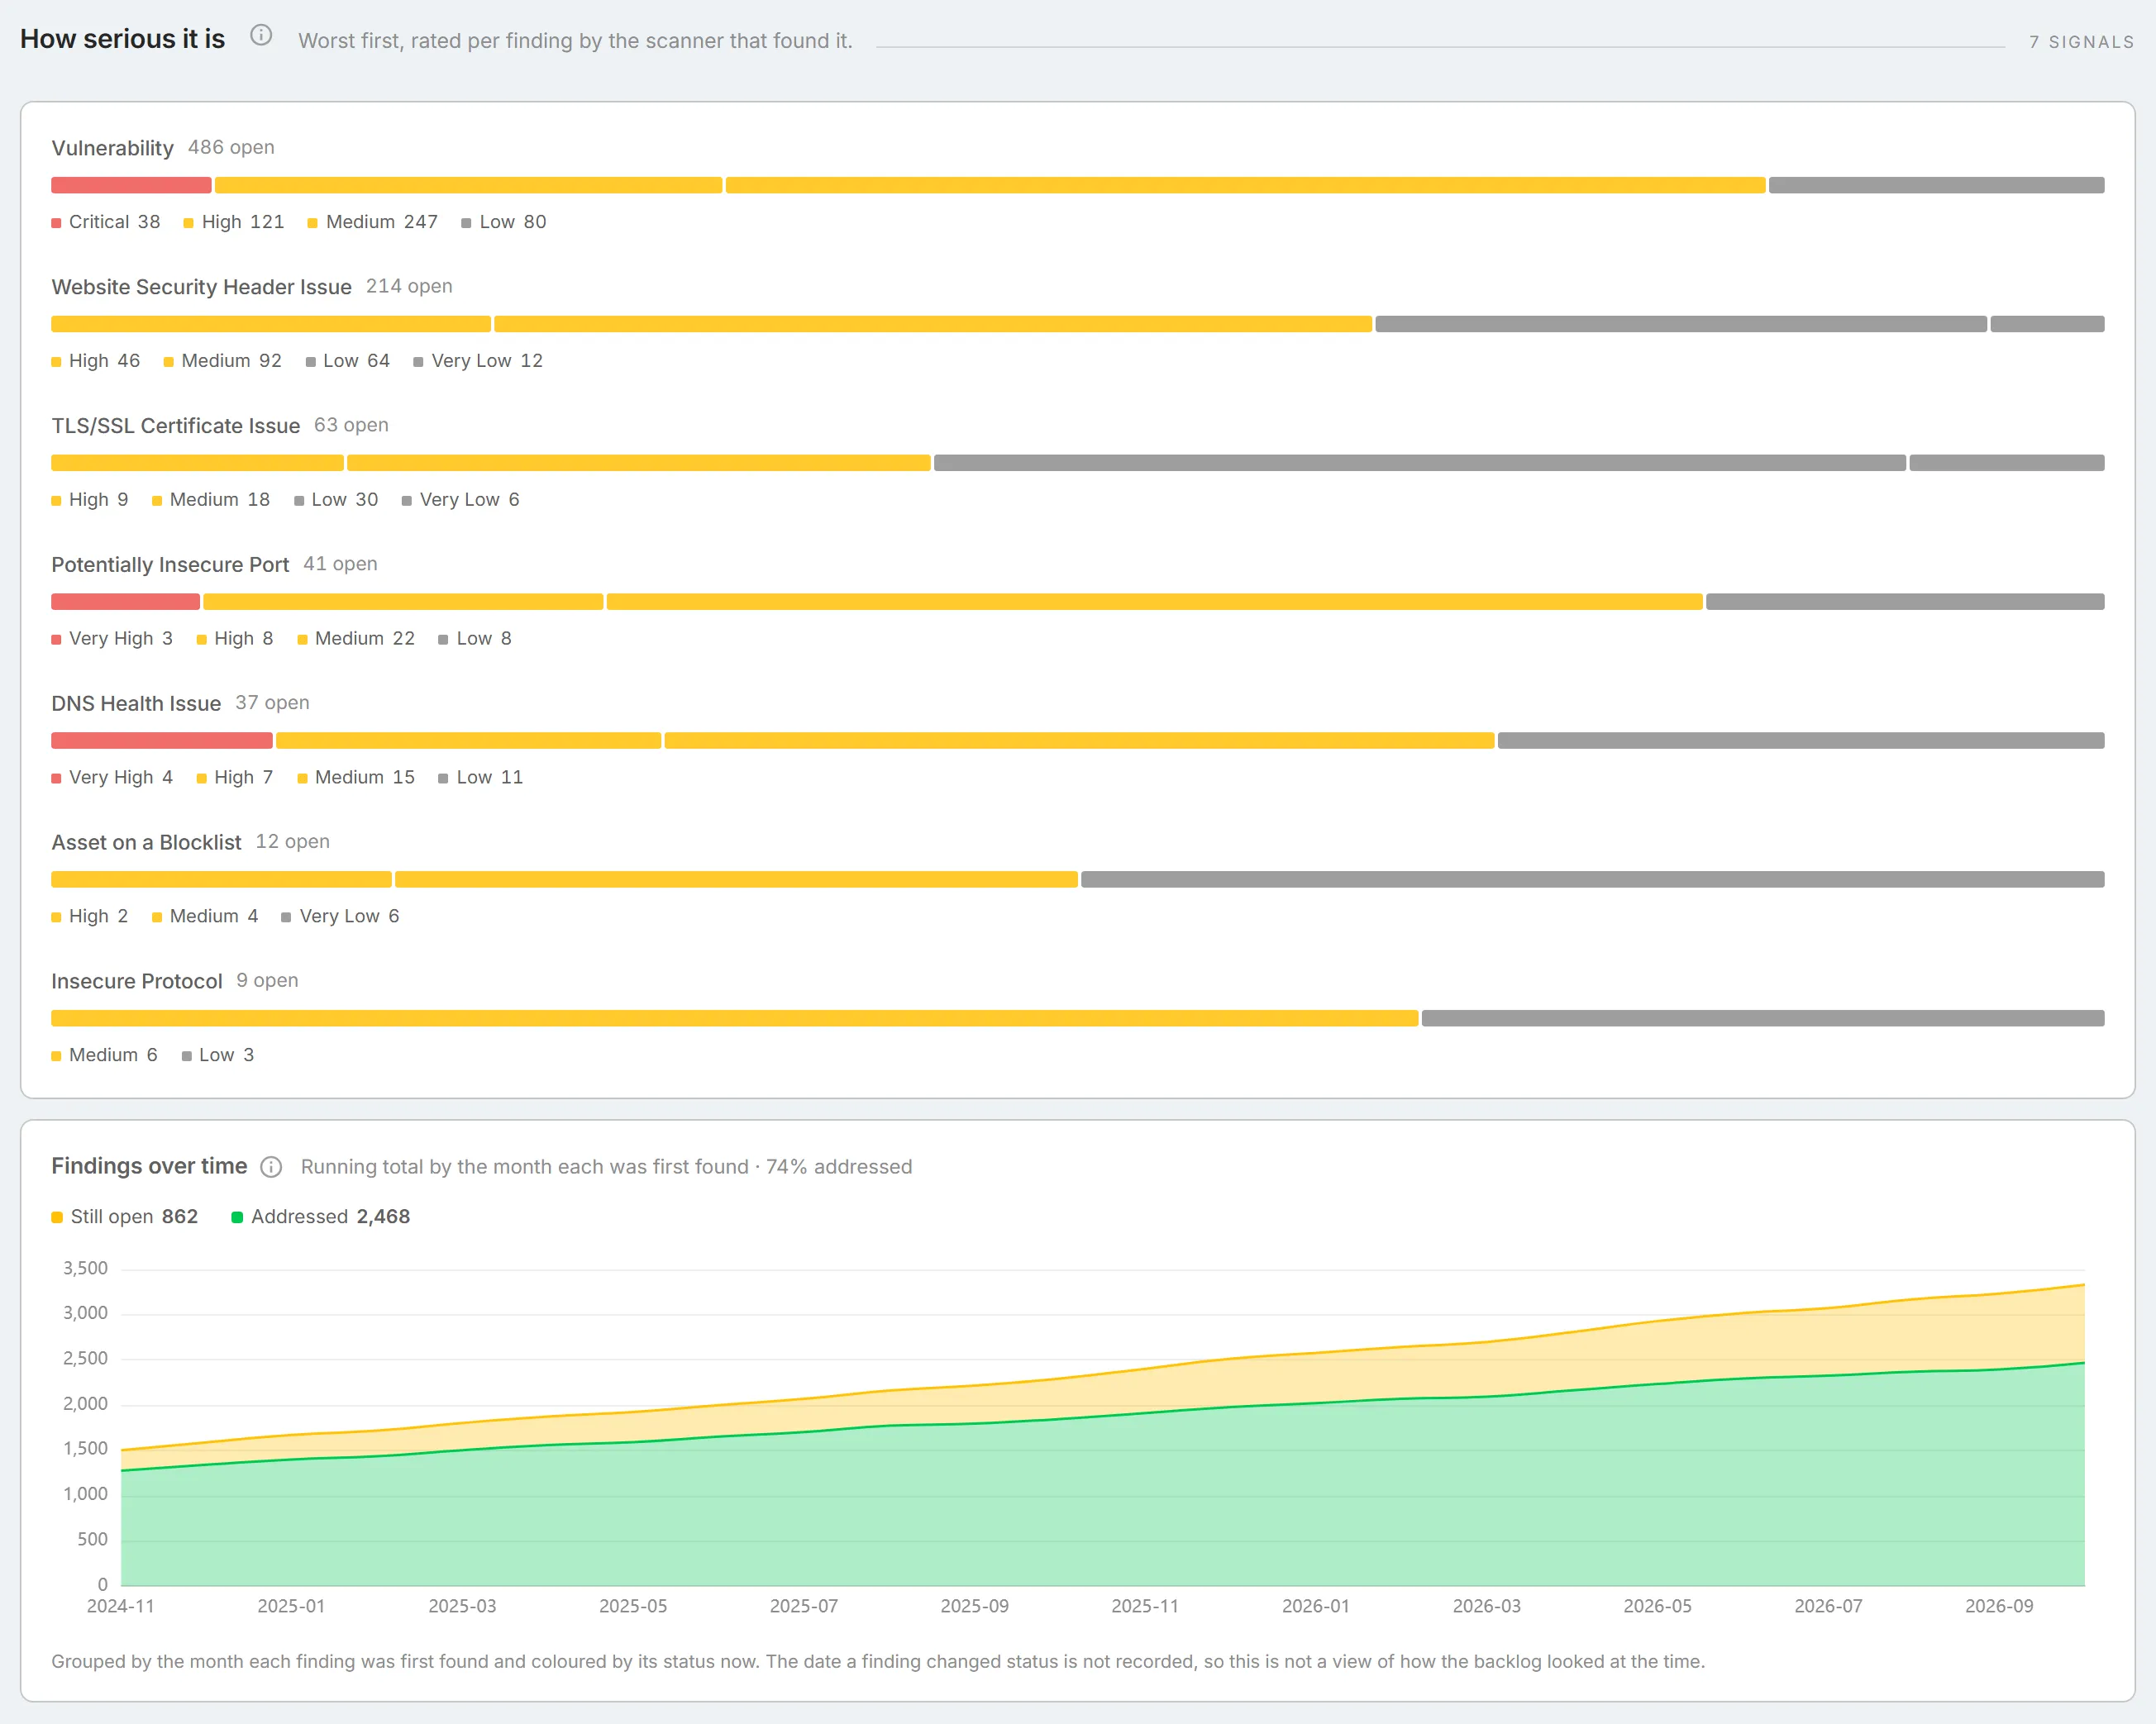
Section titled “How serious it is”One bar for each signal with open exposures, largest first. Each bar is split by severity, worst on the left, and the legend below it gives the count at each level. The note under the heading reads "Worst first, rated per finding by the scanner that found it."
- Select a signal's name to open its list.
- Select a part of a bar, or a level in its legend, to open the list filtered to that severity. Hover over a part to see its count out of the total.
- Vulnerabilities are rated on a scale that ends at "Critical". Every other signal uses the scale from "Very Low" to "Very High", which is why "Critical" appears on one bar and "Very High" on others.
- Findings the scanner left unrated are not drawn, so each bar adds up. When that leaves some exposures out, the note adds "Covers" with the number drawn out of the total.
Findings over time
Section titled “Findings over time”A running total of everything found over the last 24 months, by the month each finding was first found. The amber area is what is "Still open" today and the green area is what has been "Addressed", meaning "Resolved", "Closed Without Action", or "No Longer Seen". The totals of both sit above the chart, and the line beside the title gives the share addressed.
Each finding is coloured by its status today, because StyxView does not record the date a finding changed status. So the chart shows how much of what was found up to each month is still open now, not how the backlog looked at the time. Findings first found before the 24 months are included in the first month.
Hover over a month to see the total found to date, how many are still open and addressed, and how many were new that month. The chart does not open a list.
What we watch
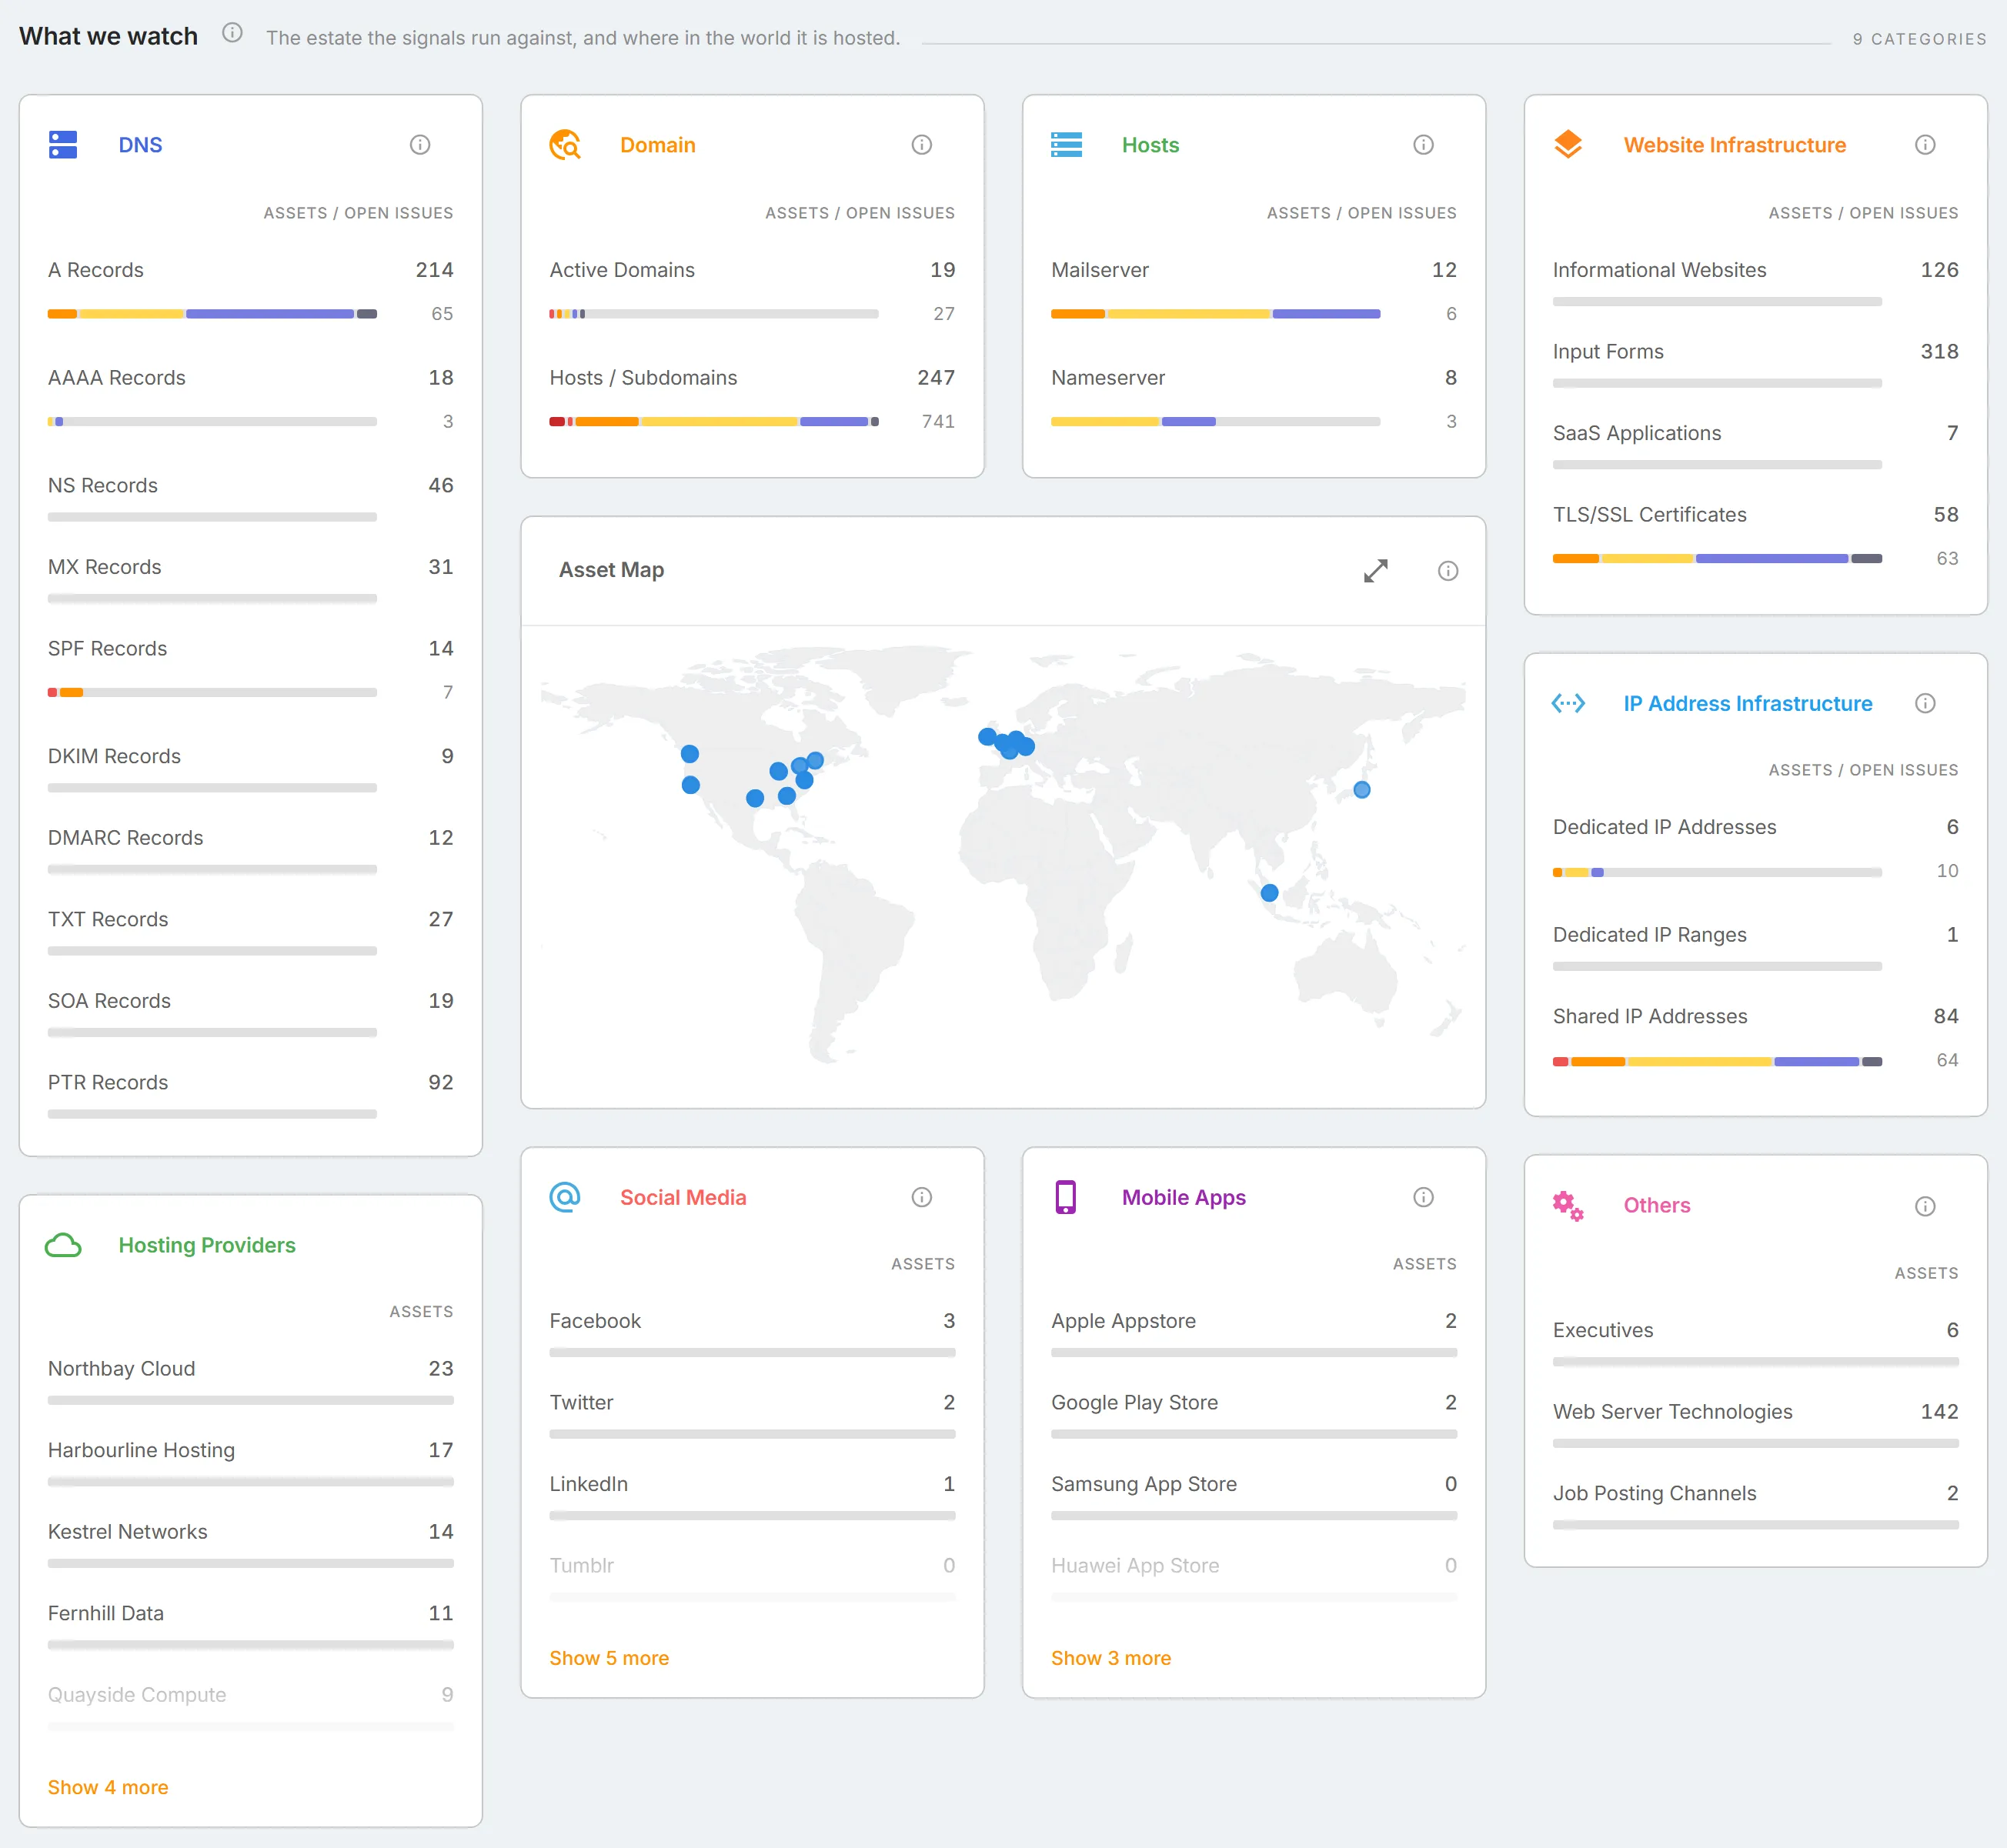
Section titled “What we watch”The assets StyxView monitors for your organisation, which every signal on this page runs against. This is an inventory, not a list of findings. A category with nothing in it means discovery found no such asset, which is worth checking against what you believe you own.
Each card counts one kind of asset. Where open issues exist, the card's column header reads "Assets / open issues": each row then shows a strip of the open issues on those assets by severity, with the number of open issues on the right. Hover over a part of the strip to see its count. Cards with more rows than fit end in "Show" and the number of hidden rows, which expands the card.
Select a row with a count above 0 to open its list:
| Card | Rows | Opens |
|---|---|---|
| "DNS" | One row per DNS record type, described below. | The list of those records. |
| "Domain" | "Active Domains" and "Hosts / Subdomains". | The Domains and Hosts tabs of "Monitored Assets". |
| "Hosts" | "Mailserver" and "Nameserver", the hosts that handle mail and DNS for your domains. | The Hosts tab. |
| "Hosting Providers" | The providers your IP addresses belong to, by the number of addresses with each. | The IP Addresses tab, filtered to that provider. |
| "Website Infrastructure" | "Informational Websites", "Input Forms", "SaaS Applications", and "TLS/SSL Certificates". | The matching tab of Monitored Assets. "TLS/SSL Certificates" opens your certificates, not their issues. |
| "IP Address Infrastructure" | "Dedicated IP Addresses" and "Dedicated IP Ranges" from your policy, and "Shared IP Addresses" that your assets share with other organisations. | The list of those addresses. |
| "Social Media" | The official accounts tracked for you on each social network. | The list of accounts on that network. |
| "Mobile Apps" | The apps published in your organisation's name on each app store. | The list of apps on that store. |
| "Others" | "Executives" monitored under Executive Protection, "Web Server Technologies", and "Job Posting Channels". | Nothing. These rows do not open a list. The technologies are on the Web Server Technologies tab. |
Hover over a card's info icon to see what the card covers. Hover over a row to show an info icon that explains that row.
DNS records
Section titled “DNS records”The "DNS" card counts these record types:
| Record | What it does |
|---|---|
| A Records | Maps a name to an IPv4 address. |
| AAAA Records | Maps a name to an IPv6 address. |
| NS Records | Names the servers authoritative for a domain. Control of these is control of the domain. |
| MX Records | Names the mail servers for a domain. |
| SPF Records | Lists the servers permitted to send mail as a domain. |
| DKIM Records | Publishes the public keys recipients use to verify signed mail from you. |
| DMARC Records | Tells recipients what to do with mail that fails SPF and DKIM checks. |
| TXT Records | Free-text records, excluding SPF. Often used for domain ownership verification. |
| SOA Records | The administrative record for each DNS zone, naming its primary name server and contact. |
| PTR Records | Maps an IP address back to a name (reverse DNS). |
Asset Map
Section titled “Asset Map”A world map of your IP addresses by where they are hosted, one point for each address. Hover over a point to see the address, its type, and the hosts associated with it. Select a point to open that IP address's details. Select the expand icon at the top right of the card to show the map across the full width of the section, and select it again to return.
Where it sits
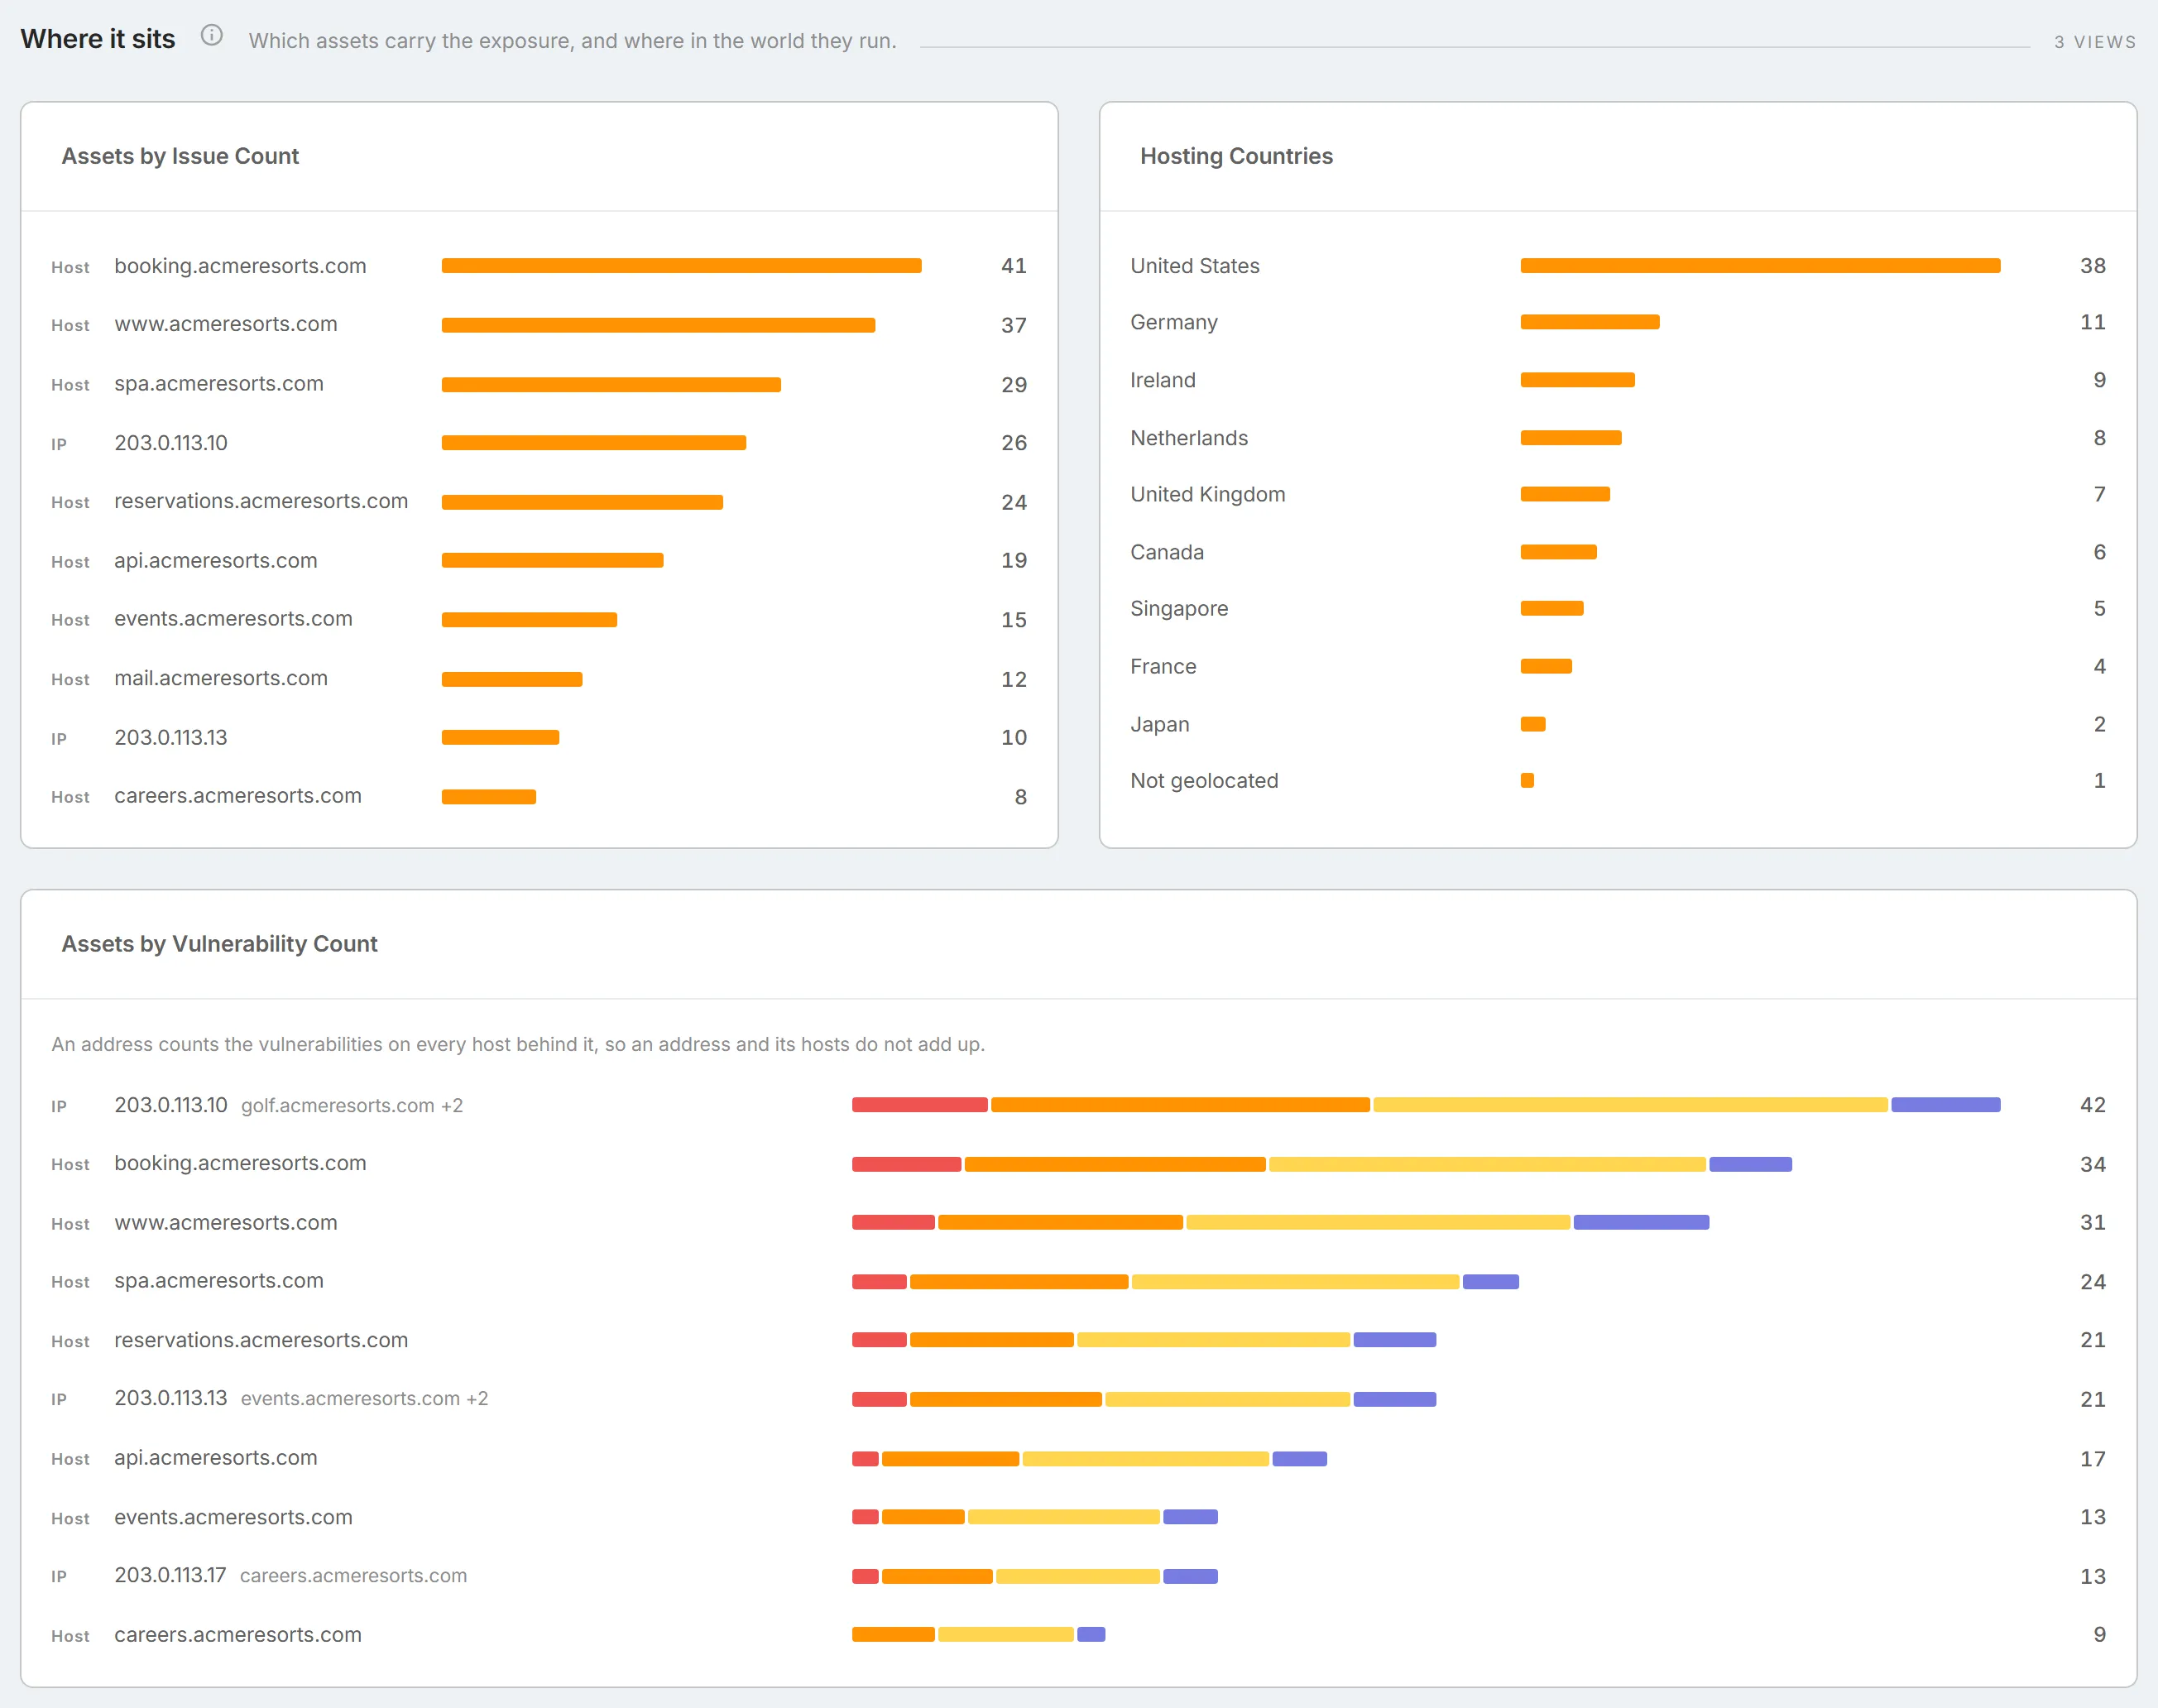
Section titled “Where it sits”Which of your assets carry the exposure, and where in the world they run. Ranking by concentration helps you plan: one host with forty issues is one maintenance window, where forty hosts with one issue each is forty.
- "Assets by Issue Count" ranks the ten hosts and IP addresses with the most open issues across every signal. Each row is tagged "Host" or "IP". Select a row to open the Hosts tab.
- "Hosting Countries" ranks the countries by how many of your IP addresses are located there. Select a country to open the IP Addresses tab filtered to it. "Not geolocated" counts addresses with no known location and does not open a list.
- "Assets by Vulnerability Count" ranks the ten hosts and IP addresses with the most open vulnerabilities, each bar split by severity from "Critical" to "Low". An IP address row also names its first host and how many more are behind it. An address counts the vulnerabilities on every host behind it, so an address and its hosts do not add up. Select a row to open Vulnerabilities.
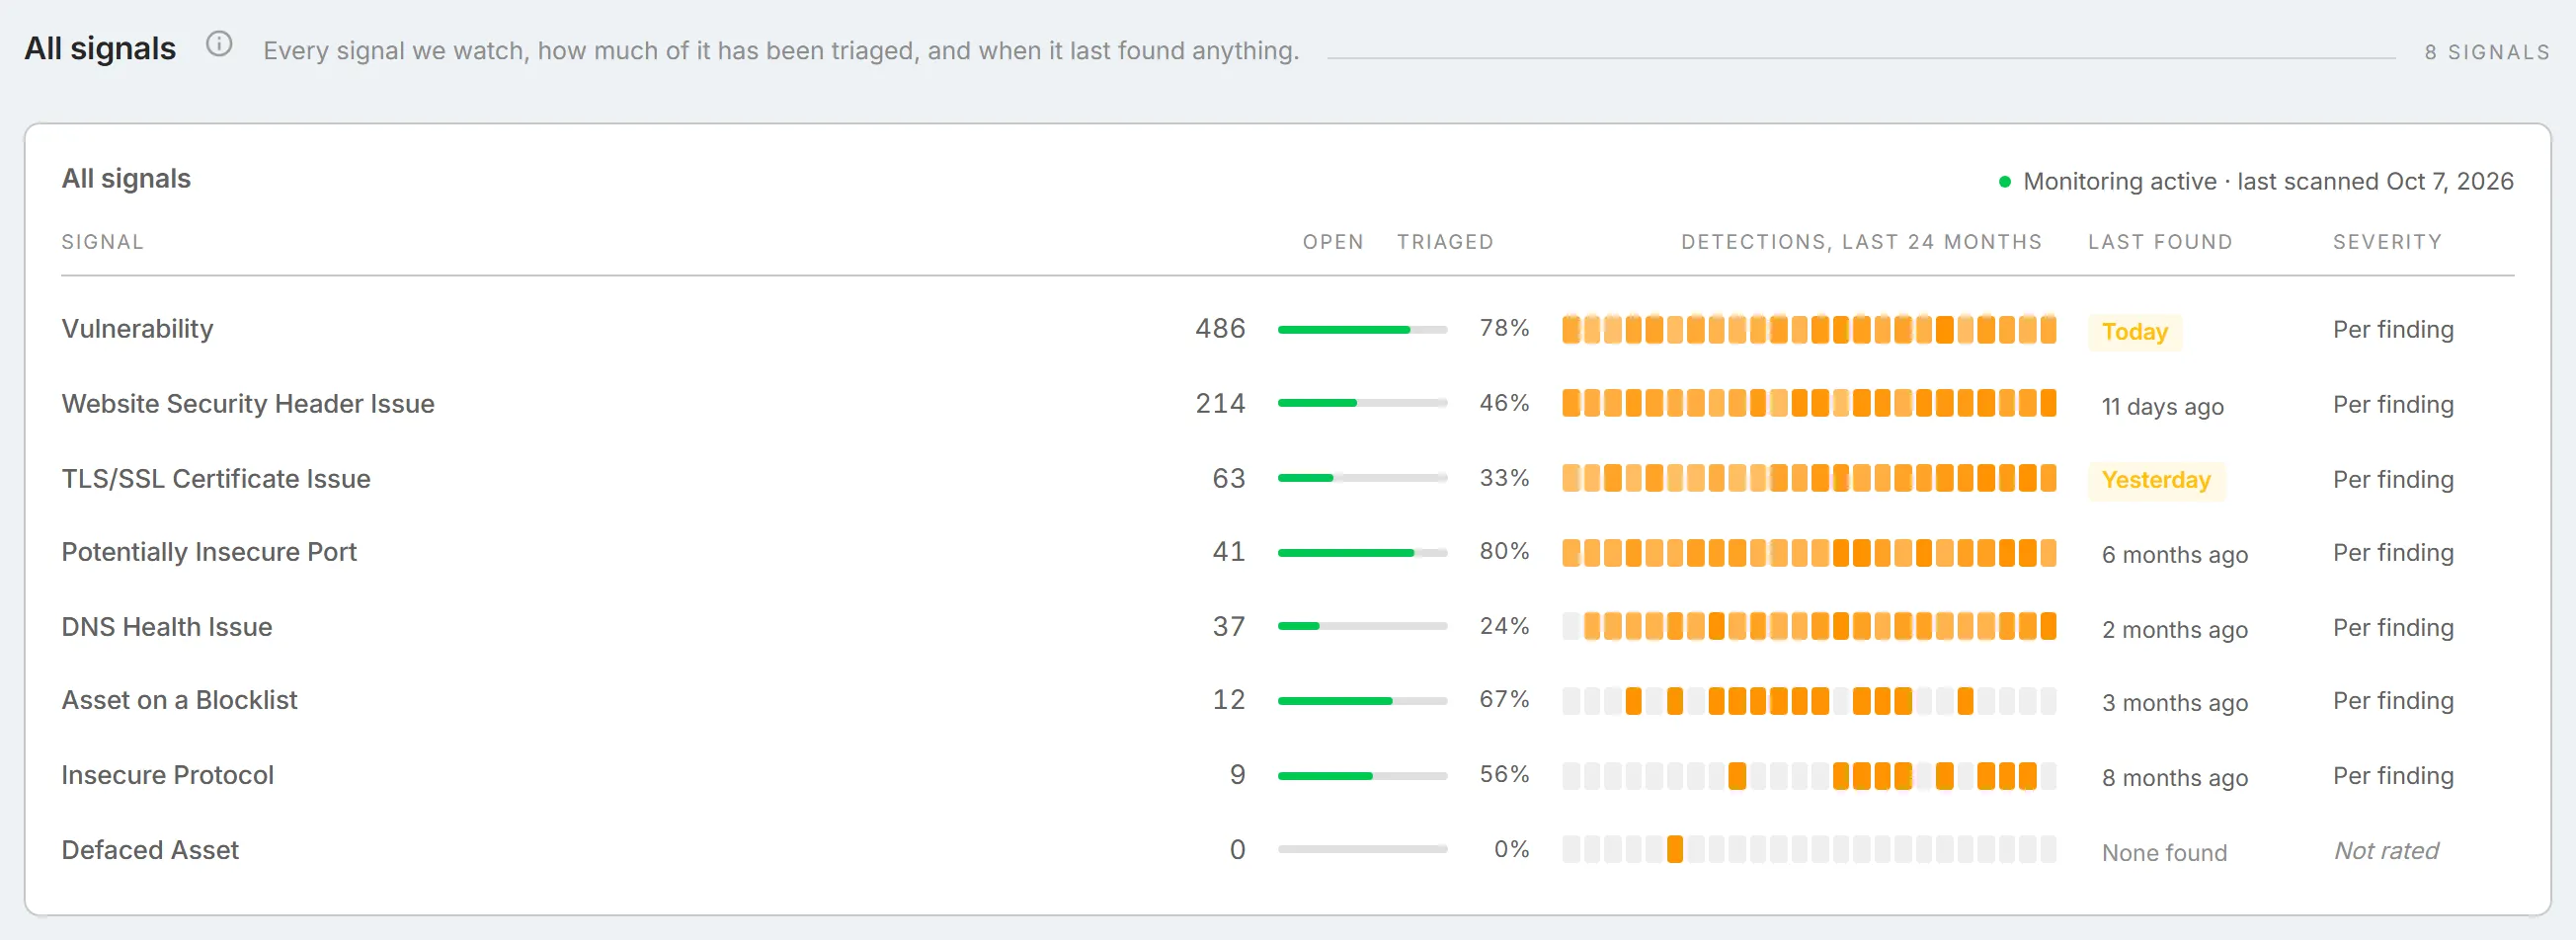
All signals
Section titled “All signals”Every Attack Surface Management signal that has found something on your organisation, with the most open first. A signal that has never found anything is left out. The card's title line reads "Monitoring active · last scanned" and the date of the last scan, so you can tell a quiet signal from one that has not run.
| Column | What it shows |
|---|---|
| "Signal" | The kind of finding. |
| "Open" | Open findings of that kind, counted the same way as the list the row opens. |
| "Triaged" | The share of the open findings that have moved past "New". |
| "Detections, last 24 months" | One cell per month, shaded by how many of the open findings were first found that month. Hover over a cell to see the month and its count. |
| "Last found" | How long ago the newest open finding was found, highlighted when it was within the last seven days. "None found" means there is nothing open. |
| "Severity" | "Per finding" when each finding is rated individually, or "Not rated" for a signal without severity ratings. |
Select a row to open that signal's list: Vulnerabilities, Website Header Issues, TLS/SSL Certificate Issues, Potentially Insecure Ports, DNS Health Issues, Blocklisted Assets, Insecure Protocols, or Defaced Assets.